A wet-lab purist to bioinformatician: "Your computational models are an absolute scam. If I can’t pipet it, it is not real science."
Optimizing Gene Expression Signatures for the Diagnosis of Arthritic Conditions Machine Learning Classification of OsteoDIP Data Utilizing the LightGBM Algorithm
(Technology prototype)
LightGBM algorithm
LightGBM uses a process called Gradient Boosting to analyze tabular data (like Excel spreadsheets or SQL tables) through a sequence of mathematical decision trees. Machine Learning (ML) is a specific subset of AI focused on using statistical algorithms of data processing to let computers autonomously learn patterns from data without being explicitly programmed. While LightGBM falls under the broad umbrella of Artificial Intelligence (AI), it does not mimic human cognitive functions or try to replicate how the human brain thinks.
LightGBM is considered better than similar Machine Learning methods primarily because of its extreme speed, lower memory consumption, and superior scalability when handling large-scale datasets.
LightGBM belongs to a family of algorithms called Gradient Boosted Decision Trees (GBDT), which includes close competitors like XGBoost and CatBoost. While these models often achieve similar predictive accuracy, LightGBM outperforms them in efficiency due to specific architectural innovations developed by Microsoft.
LightGBM's specialized machine learning model relies entirely on mathematical optimization, data structures, and statistical patterns to make decisions:
- LightGBM calculates the mathematical errors (residuals) of previous predictions and builds a new tree to minimize those errors.
- LightGBM groups continuous data features into discrete bins to speed up calculation.
- LightGBM splits data points at the exact mathematical nodes that cause the largest reduction in error, rather than growing a balanced, symmetrical tree structure.
Correction of Batch effects in microarray expression data by pyComBat
Batch effects particularly reveal themselves when merging different datasets, which have likely been built under different conditions. If not corrected, these batch effects may lead to incorrect biological insight, since the variability can be wrongly interpreted as the product of a biological process.
The pycombat package is a Python tool used to remove "batch effects" from biological data (like gene expression datasets). It adjusts the data mathematically so that the mean and variance across different technical batches are aligned. The pycombat uses an empirical Bayes statistical method (called ComBat) to flatten out the technical platform differences while carefully preserving the real biological variation. It adjusts the data mathematically so that the mean and variance across different technical batches are aligned for running a fair analysis.
Algorithm flow
We utilized the collection of arthritic data accessible within the OsteoDip database. The objective was to identify a set, in a range of 25 genes, representing a predictive diagnostic signature optimized to classify different arthritic conditions of patient subgroups using a machine learning model.
1. Data Collection:
Compete set of Clinical and Expression data were extracted from GEO component of OsteoDIP database.
- Clinical variables retained: Patient ID, Platform, Diagnosis, Tissue, Sex and Age.
- Expression variables retained: Patient ID and corresponding gene expression measurements. Multiple Gene expression values for the same patien ID were consolidated using the maximum value approach (with an alternative option to employ the mean).
- Both clinical and expression datasets underwent procedures to eliminate rows and columns containing missing values, followed by integration into a unified dataset using patient identifiers as the merge key.
The 25 most informative genes were identified via LightGBM Feature Importance analysis implemented within a cross-validation loop.
- Batch effects correction: Achieving consistency in data integration across multiple sequencing platforms.
- Informative Filtering: The analytical pipeline initially applied a variance-based filter to identify 2000 genes with elevated variance, thereby excluding non-informative, invariant genes. This does not measure if a gene is abnormally high or low; it just measures if its expression changes a lot across all patients.
- Machine Learning Classification: The LightGBM classifier subsequently selected 25 genes based on their collective predictive capacity for accurately classifying patient disease subgroups.
Gene may demonstrate substantial diagnostic utility independent of exhibiting the highest or most aberrant expression levels
- Synergistic Effects: Machine learning models look for patterns. A gene might only be selected because, when combined with other genes, it creates a highly accurate diagnostic classification rule.
- Subtle but Consistent Changes: A gene with a small but highly consistent shift between healthy and disease states can be much more useful to a classifier than a wildly chaotic, heavily over-expressed gene.
True biological abnormality (the most heavily up-regulated or down-regulated genes actually calculates after the selection occurs. Two traditional statistical metrics are employed to evaluate the designated 25 pre-selected genes:
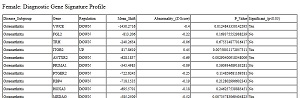
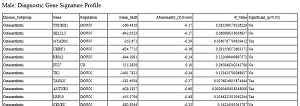
- Mean Shift / Z-Score measures the magnitude of the abnormality relative to the healthy control group. Here: Mean Shift is raw difference in average gene expression between two groups; Z-Score is standard deviation of Healthy Group.)
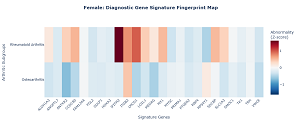
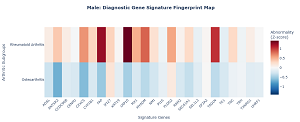
The findings are illustrated through a heatmap visualization accompanied by a corresponding profile (data table).
Example: Female vs. Male
Gene signatures were established through analysis of both female and male patient cohorts derived from the available dataset, comprising 386 patients and 5,689 genes.
Note: In the present analysis, both the 'NoArthritis' and 'Healthy control' groups were consolidated into a single 'Healthy controls' category.
25 genes, representing predictive diagnostic signature
| Sex | Heatmap | Profile |
|---|---|---|
| Female: |
|
|
| Male: |
|
|